Using Nextstrain narratives to explain WNV spread and evolution
James Hadfield
This blog post was cross posted to the Bedford lab website. You can access the narrative at nextstrain.org/narratives/twenty-years-of-WNV or read the paper at bedford.io/pdfs/papers/hadfield-wnv-nextstrain.pdf.
Our paper out today summarises twenty years of West Nile virus spread and evolution in the Americas visualised by Nextstrain, the result of a fantastic collaboration between multiple groups over the past couple of years. I wanted to give a bit of a backstory as to how we got here, how we’re using Nextstrain to tell stories, and where I see this kind of science going.
I’m not going to use this space to rephrase the content of the paper — it’s not a technical paper and is (I hope) easy to read and understand. The paper summarises all the available genomic data of WNV in the Americas, reconstructs the spread of the disease (westwards across North America with recent jumps into Central & South America), with each figure being a Nextstrain screenshot with a corresponding URL so that you can access an interactive, continually updated view of that same figure.
Instead I’d like to focus on how we used Nextstrain, and in particular its new narrative functionality, to present data in an innovative and updatable way. But first, what’s Nextstrain and how did this collaboration start?
# How this all came about
Nextstrain has been up and running for around three years and is “an open-source project to harness the scientific and public health potential of pathogen genome data”. Nextstrain uses reproducible bioinformatics tooling (“augur”) and an innovative interactive visualisation platform (“auspice”) to allow us to provide continually updated views into the phylogenomics of various pathogens, all available on nextstrain.org.
Nate Grubaugh, who had just moved from Kristian Andersen’s group in San Diego to a P.I. position at Yale, was doing amazing work collecting, collaborating, and sequencing different arboviruses. Nate wanted to be able to continually share results from the WNV work, including the WestNile4k project, and Nextstrain provided the perfect tool for this — it’s fast, so analyses can be rerun whenever new data are available and the results are available for everyone to see and interact with online. Nate, his postdoc Anderson Brito, and myself set things up (all the steps to reproduce the analysis are on GitHub) and nextstrain.org/WNV/NA was born.
The proof is in the pudding and as a result of sharing continually updated data through Nextstrain, Nate had new collaborators reach out to him. The data they contributed helped to fill in the geographic coverage and improve our understanding of this disease’s spread.
# Towards a new, interactive storytelling method of presenting results
Inspired by interactive visualisations and storytelling — which caused me to take a left-turn during my PhD — I wanted to allow scientists to use Nextstrain to tell stories about the data they were making available. I'm a big believer in Nextstrain’s mission to provide interactive views into the data (I helped to build it after all), but understanding what the data is telling you often requires considerable expertise in phylogenomics.
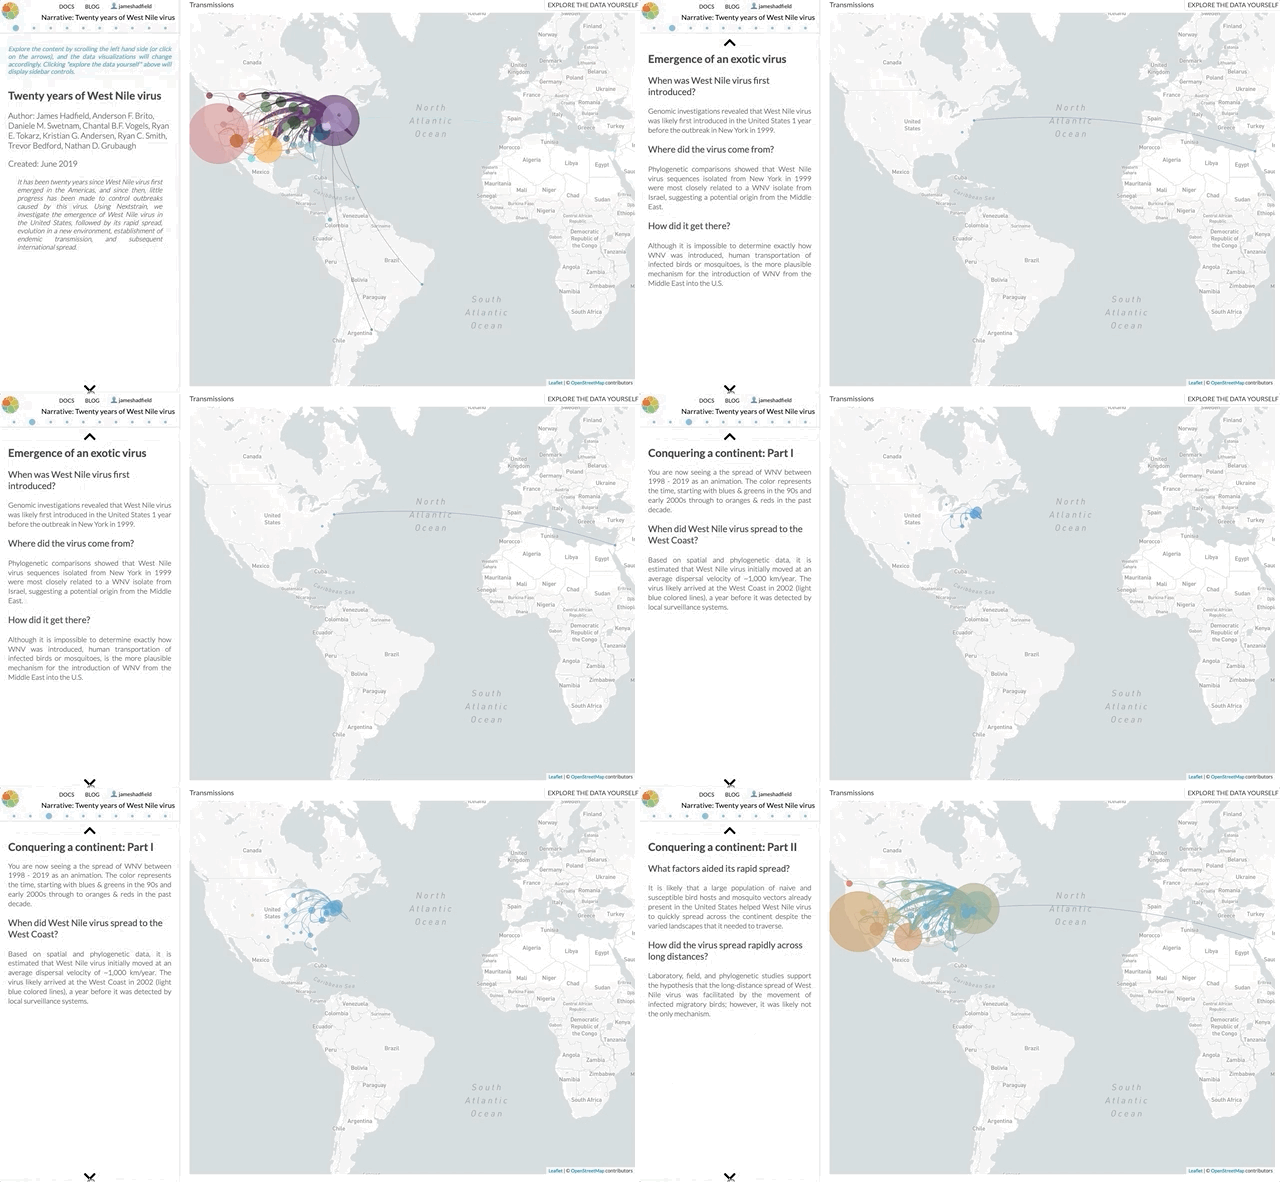
Nextstrain narratives allow short paragraphs of text to be “attached” to certain views of the data. By scrolling through the paragraphs you are presented with a story, allowing conveyance of the author’s interpretation and understanding of the data. At any time you can jump back to a “fully interactive” Nextstrain view & interrogate the data yourself.
So, the content of the paper we’ve just published is available as an interactive narrative at nextstrain.org/narratives/twenty-years-of-WNV. I encourage you to go and read it (by scrolling through each paragraph), interact with the underlying data (click “Explore the data yourself” in the top-right corner), and compare this to the paper we’ve just published.

We’re only beginning to scratch the surface of different ways to present scientific data & findings — see Brett Victor’s talks for a glimpse into the future. In a separate collaboration, we’ve been using narratives to provide situation-reports for the ongoing Ebola outbreak in the DRC every time new samples are sequenced, helping to bridge the gap between genomicists and epidemiologists. If you’re interested in writing a narrative for your data (or any data available on Nextstrain) then see this section of the auspice documentation.
A big thanks to all the amazing people involved in this collaboration, especially Anderson & Nate, as well as Trevor Bedford & Colin Megill for help in designing the narratives interface.


